Everybody has a queue story. The two hours outside a passport office. The clinic where your token says 47 and the screen is still on 12. The temple line that moves a few steps every ten minutes under the afternoon sun.
We hear these stories every week, because queues are what we work on. At Entry2Exit, we deploy queue management systems for hospitals, clinics, banks, government service centres, retail stores and logistics yards.
So people ask us things like: How long do people actually wait? How long before they give up and leave? Does a token on a screen really make anyone happier? How do temples move 80,000 people a day without chaos?
We wanted to point them to real numbers. The trouble is that those numbers are scattered all over the place.
Some sit in research papers from the 1980s. Some are in consumer surveys. Some are in government and temple board announcements. And a lot of the “stats” floating around online have no source at all.
So we pulled them together in one place.
How we built it
We used two kinds of data.
The first is public data. Peer-reviewed studies, government and temple authority releases, industry surveys and published market research. Every number from these sources links back to where we found it, so you can check it yourself.
The second is our own. We looked at queue management deployments and inquiries handled by Entry2Exit in 2026 and compared them with earlier years. These numbers are clearly marked as ours.
A few ground rules we followed:
- If a survey covers one country or one group of people, we say so.
- If two sources disagree, we show both.
- If a number is an estimate or a forecast, we call it that.
- We left out any stat we could not trace to an original source.
You are free to use any number in this article. If you do, a link back to this page helps other people find the full context. There is a short note on how to cite us at the end.
Key numbers at a glance
If you only have a minute, these are the figures we’d point you to first. Each one is explained, with its source, further down.
Waiting and how it feels
- Americans spend an estimated 37 billion hours a year waiting in line (NYT, via CustomerThink).
- Shoppers overestimate checkout waits by about 36%, and bus riders overestimate imposed waits by 2x (Hornik, 1984; Hess et al., 2004).
- 80% of patients say knowing the wait time would reduce their frustration (Becker’s).
Walking away
- Shopper satisfaction stays high up to about 4 minutes in a checkout line, then drops (M/A/R/C Research).
- 73% of UK shoppers would abandon a purchase after queuing more than 5 minutes (EE).
- 61% of US consumers have left a line before their turn, and 52% prefer virtual queues.
Healthcare
- Patients in a Kolkata hospital OPD waited 98.6 minutes for a 6.5-minute consultation (IJCM, 2024).
- India’s QR-based Scan and Share service generated 6.64 crore OPD tokens and cut registration queues from 30 to 40 minutes to 5 to 10 minutes (MoHFW).
- 24% of patients have changed doctors over long waits, while 63% of physicians think waits barely affect retention (Software Advice).
Crowds and pilgrimages
- Above 5 people per square metre, a standing crowd’s risk of crushing rises sharply (EIAI, citing G. Keith Still).
- 79% of stampedes in India happened at religious gatherings and pilgrimages (IJDRR 2013, via The News Minute).
- Slotted darshan at Tirumala took 2 to 3 hours vs 7 to 8 hours in the open queue (ETV Bharat).
- Sabarimala received 78.68 lakh devotees in 2025-26, with a daily cap of 75,000 set for 2026-27 (Verdictum).
Vehicles
- US truck drivers were detained at 39.3% of stops in 2023, losing 135 million+ hours in for-hire trucking (ATRI).
- Truck appointment systems cut port turn times by 16% to 45% (Supply Chain Dive; Bulk Transporter).
From Entry2Exit’s own data (2026)
- Our record year for queue management deployments and inquiries.
- A 30% increase in enterprise customers compared with smaller businesses.
- Healthcare and vehicle queuing at logistics sites are where demand grew most.
How much of our lives goes into waiting
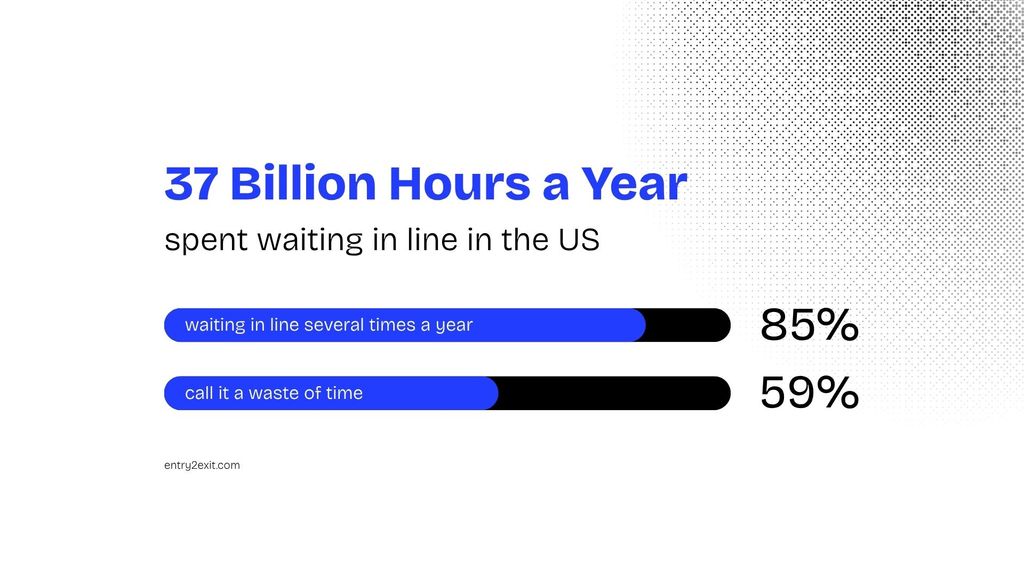
Let’s start with the biggest number we found. Americans spend roughly 37 billion hours a year waiting in line. The figure comes from a 2012 New York Times essay by Alex Stone and has been repeated ever since (CustomerThink summary citing the NYT).
In a 2024 State of Waiting in Line survey, 85% of US consumers said they wait in line at least several times a month. And 59% said waiting in line feels like a waste of their time.
Healthcare is where the time cost shows up most clearly. A 2022 Software Advice survey of more than 1,000 US adults found wait times were the number one complaint about in-person medical appointments, named by 49% of patients.
The same survey found that patients spend at most one-fifth of the time they take off work actually being seen by a doctor.
Put simply, if you take two hours off for a clinic visit, you might get 24 minutes or less with the doctor. The rest goes to travel, forms and the waiting room.
One more thing before we go deeper. Most of the numbers in this article are about the time people feel they waited, not just the time on the clock. As you’ll see in the next section, those two are rarely the same.
Why a 10-minute wait can feel like 30
If there is one idea that runs through all the research on queues, it’s this. How long a wait feels matters as much as how long it is. Sometimes more.
MIT operations researcher Richard Larson, who has studied queues for decades, has made this point for years: the psychology of a line often outweighs its raw statistics (CustomerThink).
The Houston airport story
The best-known example comes from a Houston airport, retold in the same 2012 New York Times essay (via the Association for Psychological Science).
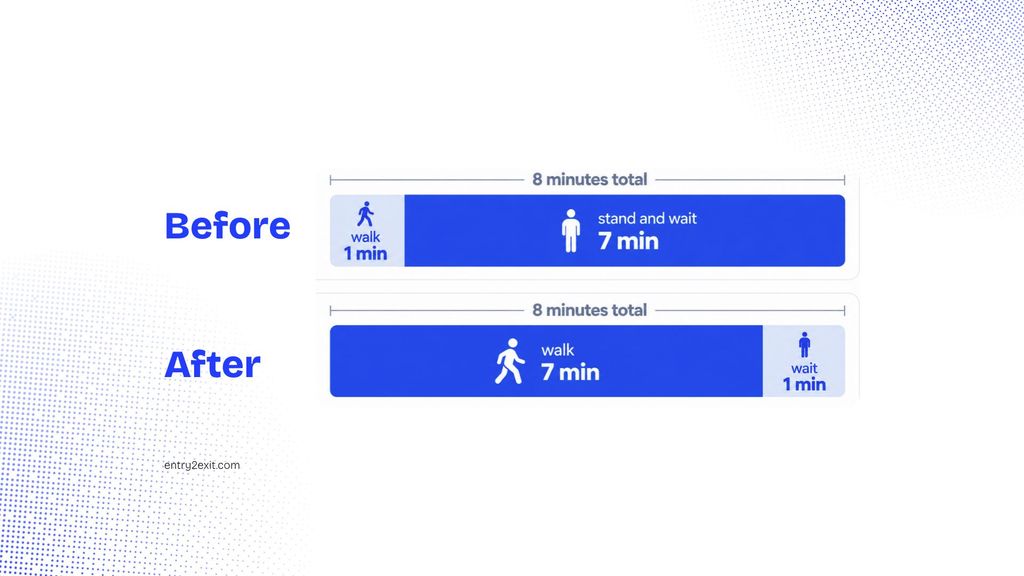
Passengers kept complaining about slow baggage claim. The airport hired more baggage handlers and brought the average wait down to eight minutes, which was within industry benchmarks. The complaints kept coming.
When they looked closer, they found passengers walked for about one minute and then stood at the carousel for about seven. So roughly 88% of the trip was spent standing still.
The fix had nothing to do with speed. The airport moved arrivals further from the main terminal and sent bags to the outermost carousel. The walk became about six times longer. Complaints dropped to almost zero.
Same total time. Very different feeling.
People overestimate their wait, and by a lot
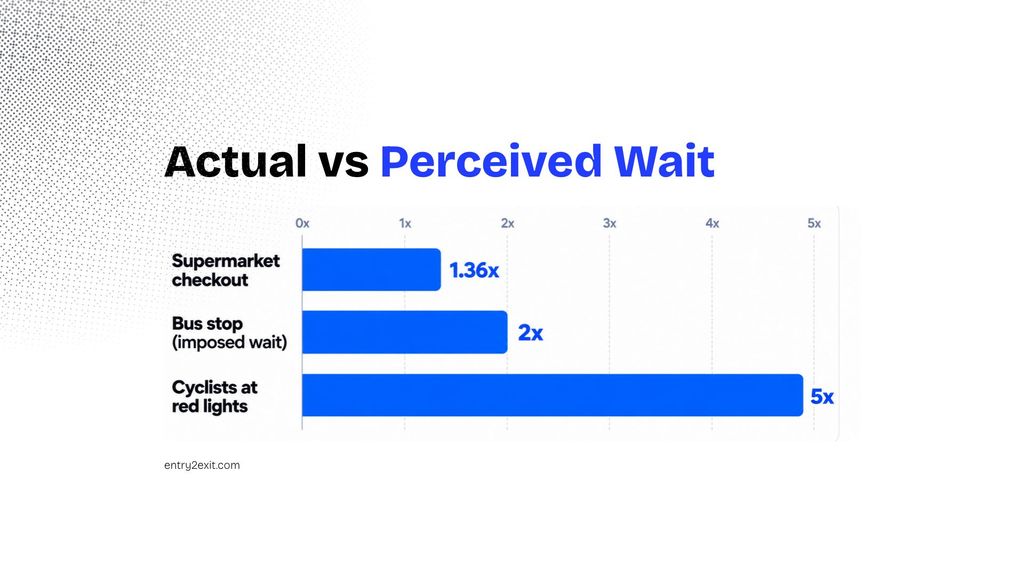
Across very different settings, studies keep finding that people think they waited longer than they did.
| Study | Setting | What they found |
|---|---|---|
| Hornik, Journal of Consumer Research (1984) | Supermarket checkout lines | The study most often cited for the finding that shoppers overestimate their wait by about 36% |
| Hess et al., Journal of Public Transportation (2004) | Students waiting for a bus at UCLA | Riders overestimated their wait by a factor of two when the transit system made them wait. When they chose to wait, they estimated it accurately |
| Fioreze et al., Transport Findings (2019) | 238 cyclists at traffic lights in Enschede, Netherlands | Cyclists overestimated their waiting time by a factor of five |
| Antonides, Verhoef and van Aalst, Journal of Consumer Psychology (2002) | Callers on hold for a commercial phone service | Telling people the expected waiting time significantly reduced how much they overestimated it |
The bus study is the one we keep coming back to. The same people, waiting for roughly the same time, judged it completely differently depending on whether they felt in control.
That is pretty much the whole case for giving people a token number and a live estimate, instead of a crowd and a closed door.
Perceived wait drives satisfaction more than actual wait
A contact centre analysis published on CustomerThink compared each caller’s real queue time with what they said in a survey afterwards.
Individual guesses were all over the place. Some people said ten minutes when they had waited under one. But both the real and the perceived wait were linked to satisfaction, and the perceived wait had the stronger link.
The analysts also estimated that around 20% of callers counted time spent in the phone menu as part of their wait. So a clunky process before the queue makes the queue feel longer too.
Maister’s eight rules of waiting, in plain terms
In 1985, David Maister, then at Harvard Business School, wrote a short paper called The Psychology of Waiting Lines. Forty years later it is still the most cited thing in this field. He set out eight propositions. Here they are in our own words, with what we see on real sites.
| Maister’s idea | What it looks like on the ground | What helps |
|---|---|---|
| Empty time drags more than busy time | People staring at a closed counter | Screens with information, forms to fill while waiting |
| Waiting to start feels worse than waiting once you’ve started | Standing at the entrance before anyone has spoken to you | Issue a token or check people in the moment they arrive |
| Anxiety stretches time | Worrying you are in the wrong line | Clear signs and a token that names the service |
| Not knowing how long makes it longer | No idea if it’s 5 minutes or 50 | Live estimated wait time on screen or by SMS |
| Unexplained delays feel longer | Counter closes with no reason given | Announce delays and the reason |
| Unfair waits feel longer | Someone who came later gets served first | One fair first-come sequence, visible to everyone |
| People wait longer for things they value more | Pilgrims queue for hours, shoppers walk out after minutes | Match the queue design to how much the visit matters |
| Waiting alone feels longer than waiting in a group | A single person in a silent waiting room | Comfortable shared spaces, or let people wait elsewhere |
Maister also offered a simple formula that sums up the idea: satisfaction equals perception minus expectation. If you set a fair expectation and then beat it, people leave happier, even if the actual wait did not change.
Just knowing the wait helps
The single most practical finding here comes from healthcare. In a Software Advice patient survey, 80% of patients said being told how long they’d wait would completely or somewhat reduce their frustration.
That’s a cheap fix. You don’t need to make the wait shorter to make it feel better. You need to make it visible.
How long people will wait before they walk away
Across retail surveys from 2008 to 2024, the breaking point keeps landing in the same place. About four to five minutes in a checkout line. About 15 minutes for most other services.
After that, satisfaction drops and people start leaving.
The four-minute line
The oldest large study we found is from M/A/R/C Research, which surveyed close to 13,000 US shoppers in 2008 across eight store types.
When the average wait was about four minutes or less, 79% of shoppers were extremely or very satisfied. After four minutes, satisfaction fell sharply in seven of the eight store types. Club stores were the only exception, where a bit over four minutes was still fine.
The same study found 10% of shoppers had left a checkout line because it was taking too long. And 43% said long lines would affect where they shop in future.
Surveys since then, mostly from the UK and US, landed in almost the same spot.
| Who was asked | What they found |
|---|---|
| US consumers | 61% have left a line before their turn. About 1 in 7 do it more than half the time |
| 1,200+ US adults | 70% will wait a maximum of 15 minutes in a physical line. Nearly 75% sometimes leave a physical line before their turn |
| UK consumers | Almost 66% abandoned a purchase and left a store because of a long queue in the past six months. Only 22% would come back later or buy through another channel |
| 1,000 UK consumers | 77% said anything over five minutes is too long to wait to buy something |
| 2,000 UK consumers | 86% avoid a store if its queues are too long. 38% have given up on a purchase. On average people wait nine minutes before leaving empty-handed |
| 2,000 UK consumers | 25% will wait two minutes at most. 59% will wait no more than four minutes. 73% would abandon a purchase after five minutes |
| About 13,000 US shoppers | Satisfaction stays high up to about four minutes, then drops |
One bad wait is often enough
What stood out to us is how little it takes to lose someone for good.
In the Box Technologies survey, 70% of UK shoppers said they were unlikely to go back to a store after a long wait on just one occasion.
In the M/A/R/C study, of the 43% who said long lines would change where they shop, 21% said they would avoid a store at times they knew it would be busy. Another 19% said they would only go there for items they could not get elsewhere.
What walkouts cost
Several UK studies have tried to put a price on queues. The numbers vary a lot because the methods are different. We’d treat them as rough ranges, not exact losses. Also keep in mind that most were commissioned by companies that sell queue or payment technology.
- EE (2014): long queues cost UK retailers over £1 billion a year in lost sales (FashionUnited).
- Qudini (2017): the average retailer loses about 10% of footfall to queues and waiting. About 26% of people who walk out drop the purchase completely, costing UK retail around £3.4 billion a year (FashionUnited).
- Adyen and 451 Research (2018): £6.4 billion went to competitors because of long queues, plus £5.6 billion from people spending less or leaving altogether. Close to £12 billion in total (Retail Tech Innovation Hub).
- Adyen (2019): £11.3 billion lost to long queues, the second biggest cause of lost store sales after items being out of stock (FashionNetwork).
Even the lowest estimate is a billion pounds a year, in one country, from people walking away from lines.
Virtual lines hold people longer
This is where the data gets interesting for anyone running a busy service point.
Nearly 75% of people said they sometimes leave a physical line before their turn. Fewer than half said the same about virtual lines.
And people were willing to wait much longer when they didn’t have to stand there. Nearly 71% said they would wait an extra 15 minutes or more in a virtual queue (Total Retail).
By 2024, 52% of US consumers said they prefer virtual queues to physical lines, and nearly 70% said they would rather book an appointment than wait in line at all.
This lines up with the bus stop study in the last section. People don’t mind waiting nearly as much when they control where they wait.
Younger people walk first
Age shows up again and again. A study found people aged 18 to 44 are the most likely to leave a physical line before their turn.
A shopper survey published by checkout technology firm StrongPoint found that 25% of respondents under 29 leave their purchases and walk out when they see long queues. The same group was three times more likely than other ages to pick self-checkout.
StrongPoint also pointed to the perception gap from the last section. Most of its respondents said they spend up to 15 minutes in checkout queues, while the company’s own in-store measurements usually showed 3 to 4 minutes.
Waiting time vs service time, sector by sector
In almost every sector we looked at, the service itself is short. The wait around it is what’s long. Indian hospital studies show patients waiting 8 to 15 minutes for every minute they spend with the doctor.
Healthcare in India: long waits, short consultations
This is the gap we hear about most from clinic and hospital teams. Here is what published Indian studies measured.
| Hospital and study | Average wait | Average time with the doctor |
|---|---|---|
| Tertiary medical college hospital, Kolkata (Indian Journal of Community Medicine, 2024) | 98.6 minutes from registration to entering the doctor’s room. General medicine averaged 122 minutes | 6.5 minutes |
| Tertiary care hospital, Maharashtra (IJCMPH) | 59 minutes per visit | 6.9 minutes |
| Neurosurgery OPD, PGIMER Chandigarh (Indian Journal of Neurosurgery, 2015) | 45 minutes in the registration queue, then 60 minutes outside the doctor’s room | 10 minutes |
In the Kolkata study, that works out to about 15 minutes of waiting for every minute of consultation.
The Chandigarh study adds another detail. Patients spent around 3 hours of the visit just on paperwork, and the whole trip from home and back took about 9 hours.
A tertiary hospital in Faridabad showed the wait is spread across every counter, not only the doctor’s door. Patients waited 38.2 minutes to register, 41.3 minutes for the consultation, 49.6 minutes for sample collection and 61 minutes at the pharmacy (Indian Journal of Public Health, 2024).
And consultations can be very short. A CAG audit of government hospitals in Jammu and Kashmir found that 58% of patients sampled were examined for less than five minutes, and fewer than 2% got more than 15 minutes.
India’s QR token experiment at national scale
The most interesting healthcare queue data we found is from India’s own public system.
Under the Ayushman Bharat Digital Mission, patients can scan a QR code at the OPD counter, share their ABHA health ID, and get a token number on their phone. No form filling in the line.
According to the Ministry of Health and Family Welfare, by November 2024 this “Scan and Share” service was running at 17,481 health facilities across 35 states and union territories. It had generated 6.64 crore (66.4 million) tokens, at roughly 2 lakh (200,000) a day.
The ministry says it cut registration queue time from 30 to 40 minutes down to 5 to 10 minutes, saving about 3.3 crore (33 million) person-hours.
That makes it one of the largest digital token systems anywhere, and it runs in government hospitals.
Healthcare in the US: waiting weeks, then waiting again
In the US, the first wait is for the appointment itself. The AMN Healthcare and Merritt Hawkins 2022 survey of 1,034 physician offices found it takes an average of 26 days to get a new patient appointment in 15 large US cities. That’s up 8% since 2017 and 24% since 2004.
Dermatology had the longest average wait at 34.5 days, and family medicine dropped to 20.6 days.
Then comes the waiting room. A few patient survey numbers stood out to us:
- 30% of patients have walked out of an appointment because of a long wait, and 20% have changed doctors over it.
- 24% of patients say they’ve changed doctors because of long waits. Yet 63% of physicians believe wait times have no or minimal impact on keeping patients.
- 41% of patients look for information on wait times when they read reviews of a new doctor (same source).
That 24% vs 63% gap is the clearest example we found of providers and patients seeing the same wait very differently.
Emergency departments: when people leave without being seen
In emergency care, a long wait doesn’t just cost satisfaction. Some patients leave before a doctor ever sees them.
- In the US, the share of ED patients who left without being seen rose from 1.1% in 2017 to 2.1% by late 2021. At the worst-performing hospitals it went from 4.3% to 10% (JAMA Network Open, via BenefitsPro).
- At King Khalid University Hospital in Riyadh, 3.81% of ED visits ended with the patient leaving unseen in a 2023 study (PMC).
- In a classic Toronto study, 60% of those who left blamed the wait, and 92% believed they should see a doctor within one hour (Annals of Emergency Medicine).
In England, the NHS target is for 95% of A&E patients to be admitted, transferred or discharged within four hours. It was last met nationally in 2013-14. In 2025-26 the figure was 74.9%, and in May 2026 an average of 2,241 patients a day were waiting in A&E corridors (National Audit Office, 2026).
Banking: branch waits differ a lot by country
J.D. Power has measured branch waits across several markets. The gap between countries is big.
| Market | Average branch wait | Source |
|---|---|---|
| Singapore (2017) | 12.4 minutes | J.D. Power |
| Canada (2017) | 6.1 minutes | J.D. Power |
| Australia (2017) | 5.0 minutes | J.D. Power |
| United States (2017) | 3.6 minutes | J.D. Power |
| Brazil (2011) | 19.2 minutes | Retail Banker International |
Long waits seem to push people away from branches altogether. In the same Singapore study, only 44% of customers had visited their main bank’s branch in the past year, compared with 71% in the US and 81% in Canada.
There’s a twist, though. J.D. Power found customers who were greeted and then waited 6 to 10 minutes were more satisfied than customers who waited zero minutes but were not greeted (American Banker). Acknowledgement can matter more than speed.
Branch staff see the waits too. In Zebra’s survey of more than 1,300 branch employees in the US and UK, 75% of customers were reported to wait more than six minutes, and 25% more than 11 minutes (Business Wire).
Government services in the GCC: waiting time as a public KPI
In the UAE, waiting time is something government entities publish and compete on.
- Dubai’s RTA links its Customer Happiness Centres to a central operations room that monitors customer waiting times live (Gulf News).
- Under its 360 services policy, the RTA reported zero waiting time for 82 services and a customer happiness index of 98.9% (Dubai Media Office, 2025).
- At RTA’s Umm Al Ramool centre, 29,000 customers visited in one quarter and the average transaction took 2.5 minutes (RTA).
- Dubai Customs brought the average wait on its contact centre line to 24 seconds in the first half of 2026 (WAM).
In our experience, that public focus on waiting time is one reason GCC organisations tend to ask for queue dashboards and reports, not just token machines.
Airports: clear standards at huge volume
The US TSA works to published standards: under 10 minutes for PreCheck lanes and under 30 minutes for standard screening (TSA).
In one record summer it screened 262 million passengers and crew, and 99.7% waited less than 30 minutes in standard lanes. In early 2023, TSA said 92% of PreCheck members waited less than five minutes.
The lesson for other sectors is simple. A clear, published wait standard gives everyone something to measure against.
When a queue becomes a crowd safety problem
Most of this article is about comfort and satisfaction. This section is about safety. Crowd science gives a clear red line: once a standing crowd goes above about five people per square metre, the risk of a crush rises sharply.
And in India, a 2013 study found that 79% of stampedes happened at religious gatherings and pilgrimages.
The density numbers
G. Keith Still, a crowd scientist at the University of Suffolk, has spent decades measuring what happens as people pack closer. His thresholds are used by event planners around the world.
| People per square metre | What happens |
|---|---|
| 2 | Walking speed starts to drop |
| Above 3 (moving crowd) | Crowd speed drops significantly. Still treats this as the hazard level for moving crowds |
| 4 | People start touching without meaning to |
| Above 5 (standing crowd) | Risk to life from crushing rises sharply. Surges and crowd collapse become possible |
| 6 to 7 | Everyone is in physical contact, so any push ripples through the crowd. That’s like fitting 1,600 to 1,800 people on a tennis court |
| 10 | Movement is close to impossible |
For scale, a 2024 PLOS One study of the 2022 Itaewon crush in Seoul estimated an average density of 7.57 people per square metre, peaking near 9.95. That night, 159 people died (Nautilus).
Seoul Metro counted 81,573 people getting off at Itaewon station that evening, compared with 31,878 the year before (Reuters, via WDEZ). Police said they had only 137 officers in Itaewon that night (same source).
India’s record
According to NCRB data compiled by Factly, 3,074 people died in stampedes in India between 2001 and 2022.
A 2013 study in the International Journal of Disaster Risk Reduction, by Faisel T. Illiyas and colleagues, found that religious gatherings and pilgrimages were the venues for 79% of stampedes in the country (The News Minute).
The study’s authors point out that many pilgrimage sites are in remote areas with narrow paths and limited infrastructure, which makes crowds harder to manage.
The queue for the queue
One recent case matters a lot for anyone thinking about token systems.
On 8 January 2025, six devotees died in Tirupati while waiting for Vaikunta Dwara darshan tokens (Deccan Herald). Tirumala Tirupati Devasthanams (TTD) had planned to hand out 1.2 lakh (120,000) tokens from 94 counters at nine centres. Crowds began gathering a day early.
The crush didn’t happen inside the temple. It happened at the counters that issue the tokens meant to control the crowd.
That is the risk with any token system that still needs people to show up in person to get a token. If demand is far higher than supply, the counter becomes the new bottleneck. We come back to how TTD changed its process in the next section.
Technology helps, but people still have to act on it
The 2025 Maha Kumbh in Prayagraj was one of the largest crowd management exercises ever attempted. Over 45 days it drew more than 65 crore (650 million) devotees (The Tribune).
Authorities ran about 2,750 CCTV cameras across the site, around 250 of them AI-enabled. They measured crowd density per square metre at the bathing ghats and people flow per minute, feeding an integrated command centre (The Federal).
Even so, at least 30 people died in a stampede on 29 January 2025, according to police (Down To Earth).
One senior official told Context that the AI cameras had been sending alerts about crowd surges, but there weren’t enough police on the ground at that spot to act on them (Context).
The lesson we take from this is simple. Measuring a crowd is step one. Controlling how many people arrive at a point at the same time is step two, and that’s where slot-based tokens and virtual queues come in.
How India’s biggest temples manage queues of millions
India’s major pilgrimage sites have become some of the largest queue management operations in the world. Almost all of them have moved in the same direction: from “come and stand in line” to “book a slot, then come”.
The table below sums up the four sites we looked at closely.
| Site | Scale | How entry is controlled | Source |
|---|---|---|---|
| Sabarimala, Kerala | 78.68 lakh (7.87 million) devotees in the 2025-26 Mandala-Makaravilakku season | Virtual queue booking, a smaller spot booking quota, and a daily cap of 75,000 upheld for 2026-27 | Verdictum |
| Tirumala, Andhra Pradesh | 90,000 to 1 lakh devotees a day at peak | Time-slotted SSD tokens, online tickets, and online registration with a draw for Vaikuntha Dwara darshan | ETV Bharat |
| Vaishno Devi, J&K | 94.84 lakh (9.48 million) pilgrims in 2024 | Mandatory RFID yatra card, with a daily cap of 50,000 under NGT guidelines | ETV Bharat, Deccan Herald |
| Char Dham, Uttarakhand | Over 10 lakh registrations within 10 days of opening in 2025 | Mandatory Aadhaar-verified registration with daily limits per shrine | Hindu Tone |
Sabarimala: a virtual queue under a court’s watch
Sabarimala gives the clearest picture we found of a virtual queue handling record demand.
For the 2025-26 season, the virtual queue opened on 1 November with a limit of 70,000 bookings a day. Another 20,000 a day could get darshan through real-time booking counters at places like Nilakkal and Pampa).
Within days of the season opening, the Kerala High Court capped spot bookings at 5,000 a day as numbers ran ahead of plans. Virtual queue slots for the whole month had already been booked.
Even with those limits, the Special Commissioner reported that more than one lakh pilgrims were reaching Sannidhanam on some days. The court ordered that only devotees with a valid pass, arriving in their booked time slot, be let in.
The season ended with 78.68 lakh devotees. For 2026-27, the High Court upheld a daily ceiling of 75,000 and asked for the virtual queue to be upgraded with real-time updates and cancellation options. It also allowed booking amounts to be forfeited when people don’t turn up, to discourage slot-blocking.
No-shows are a real issue for any booking system. On one early day of an earlier season, 30,000 people booked through the virtual queue and 26,942 turned up, a no-show rate of about 10%.
There’s also a nice detail that shows how a booking can do more than hold a place in line. The virtual queue booking ID is the basic document pilgrims need to claim the ₹5 lakh accident insurance cover offered during the pilgrimage.
Tirumala: time slots cut the wait to a third
At Tirumala, the difference between a slotted and an unslotted queue is easy to see.
During the summer 2026 rush, TTD reported that Slotted Sarva Darshan (SSD) token holders were finishing darshan in two to three hours. People in the general free queue were taking seven to eight hours. The temple was handling 90,000 to 1 lakh devotees a day, up from around 70,000 earlier.
Same temple, same deity, same day. The only difference is whether you had a time slot.
The catch is supply. SSD tokens are limited. On one July 2026 day, TTD issued 10,000 tokens plus 2,000 for pilgrims walking up the Srivari Mettu footpath, and the whole quota was gone within an hour.
After the January 2025 stampede at the token counters, TTD changed how it handles its biggest event. For Vaikuntha Dwara darshan, it scrapped offline token counters and moved to online registration, followed by a draw. Tokens are now issued through the TTD website, app and WhatsApp.
TTD also shared how it plans the time. Of the 240 hours across the ten days, 182 hours go to general pilgrims’ darshan, and 164 of those to ordinary pilgrims (same source). That’s queue capacity planning, done in public.
Vaishno Devi Templa: RFID cards and a hard daily cap
The Vaishno Devi shrine board issues an RFID yatra access card to every pilgrim. Without it, you’re stopped at the Banganga check post.
The cards let the board track pilgrims along the route in real time and stay within the 50,000 a day cap set under NGT guidelines. The board says pilgrims can now get a card within 15 minutes, and each card comes with ₹5 lakh accident insurance.
The RFID system is backed by a network of more than 700 CCTV cameras with real-time reporting. Pilgrims have to start the yatra within 12 hours of getting the card and return to Katra within 24 hours
Annual numbers show the scale: 91.25 lakh in 2022, 95.22 lakh in 2023, 94.84 lakh in 2024 and 69.79 lakh in 2025, a year with a 22-day suspension (ETV Bharat, official yatra statistics).
Char Dham: registration as the queue
For the Char Dham Yatra in Uttarakhand, registration itself works as the queue. It is mandatory, Aadhaar-verified, and tied to daily limits for each shrine.
In 2025, more than 10 lakh devotees registered within 10 days of registration opening. Kedarnath alone had over 6.5 lakh online registrations before the season began, and the state raised the online share of registrations from 60% to 75% to meet demand.
What these temples teach us about queue psychology
Put these cases next to the research from earlier and a pattern shows up.
- Certainty. A booked slot answers “how long will this take?” before the pilgrim even leaves home. Maister’s point about uncertain waits feeling longer applies directly.
- Control. People choose their date and time. The UCLA bus study found people judge a wait accurately when they chose it, and overestimate it when it’s forced on them.
- Fairness. An online draw is visibly fair. A crowd pushing toward a counter isn’t.
- Safety. Slots spread arrivals over the day, so fewer people are standing at the same spot at the same time.
The hard parts are also clear: no-shows, fake passes, people without smartphones, and demand that simply outstrips supply. Every site above still keeps some form of walk-in or spot booking for that reason.
Virtual queuing at global scale: two cases from outside India
Outside India, two events show very different sides of managing a queue of hundreds of thousands. One is planned years ahead with digital IDs. The other was put together in a few days with a YouTube stream and wristbands.
Hajj: a smart card for every pilgrim
Saudi Arabia’s General Authority for Statistics recorded 1,673,230 pilgrims at Hajj in 2025, including 1,506,576 from outside the Kingdom. More than 420,000 workers from the public and private sectors served them.
Every pilgrim carries a Nusuk smart card, which links identity, accommodation, transport and health data in one system. The wider Nusuk platform has passed 51 million users and offers more than 130 digital services.
During Hajj 2025, more than six million readings were recorded from Nusuk cards, used to support field safety and fast access for pilgrims.
The ministry reported moving more than 1.67 million pilgrims to Mount Arafat with no security or health incidents, using smart cameras, a 24/7 monitoring hub and AI analysis of crowd data (Gulf News).
For context, the 2015 crush at Mina killed more than 2,000 people.
The total number of pilgrims is managed too. Hajj attendance peaked at 3.16 million in 2012 and has been kept between roughly 1.7 and 2.5 million in normal years since. Capping the number of people is the first and most basic form of queue management.
The Queen’s lying-in-state: a queue with a live tracker
When Queen Elizabeth II lay in state in September 2022, the UK government had to manage a public queue of a size few people had seen before.
Some 750,000 people were expected to file past the coffin over four and a half days. At one point the line stretched about 4.9 miles, measured by the culture department’s live queue tracker (Reuters, via Daily Maverick).
The department streamed that tracker on YouTube so anyone could see where the end of the line was. On 16 September it warned that the expected wait was over 24 hours (ITV News).
When the queue hit capacity, entry was paused and a second queue formed for the main queue. People in it got wristbands confirming their place (Yahoo News). A wristband is a token in its simplest form.
It wasn’t easy on people. The London Ambulance Service reported 1,078 people in the queue needed medical treatment.
Still, reports from the line described mourners chatting with police and marshals and swapping notes on wait times (same source). We think the live tracker had a lot to do with that calm. People could see the length and the expected wait before they joined. Maister would recognise it straight away: a long wait that is known and fair feels very different from a short one that isn’t.
Every way to run a queue today, from logbooks to virtual lines
There are roughly ten common ways to manage a queue in 2026. Most organisations we speak to use two or three of them at once, often without thinking of them as a “system”.
The table compares them, based on what we see on site and the data in this article.
| Method | How it works | Where you’ll see it | Good at | Weak spots |
|---|---|---|---|---|
| Open line, no system | People stand in the order they arrive | Small shops, ticket counters, temple darshan lines | Costs nothing | No visibility, easy to cut in, people can’t leave |
| Logbook or register | Staff write names on arrival and call them in order | Small clinics, government offices, reception desks | Simple record of who came | Slow, no wait estimate, hard to report on |
| Manual token | Staff hand out numbered paper or plastic tokens | Clinics, banks, ration shops, OPDs | Fair order, cheap | Tokens get lost or reused, no data, still need a crowd at the counter |
| Printed ticket dispenser | Visitors pull a numbered ticket from a roll or machine | Pharmacies, deli counters, service centres | Self-service, fair | Single line only, no routing to different services |
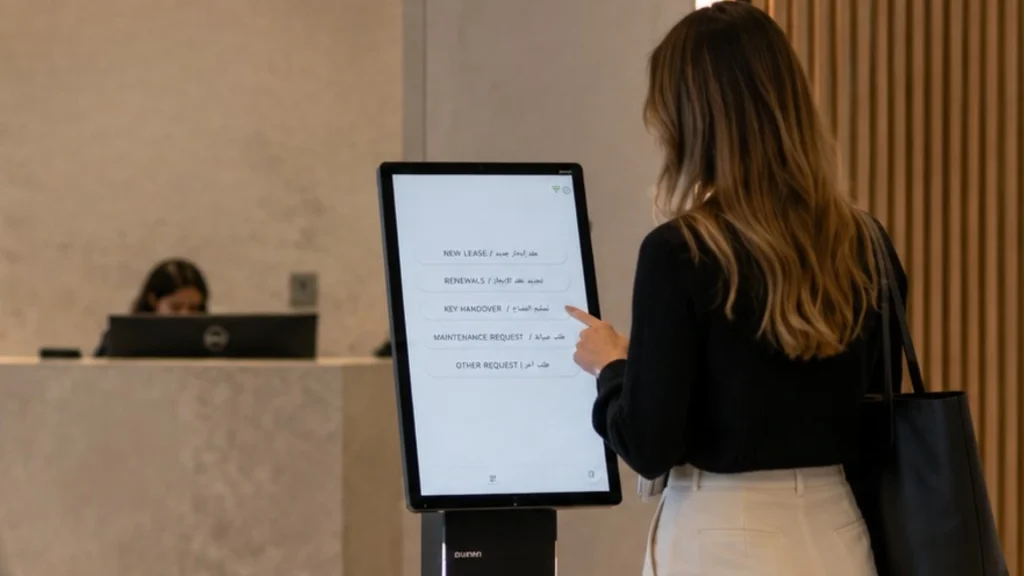
| Digital queue system with kiosk and display | Visitors pick a service on a kiosk, get a token, and are called to a counter on a screen | Hospitals, banks, government centres, telecom stores | Routing by service, live wait times, reports per counter and staff | Needs hardware, setup and staff training |
| SMS alerts | Token or position is sent by text, with a reminder when your turn is near | Clinics, service centres | Works on any phone | Message costs, one-way |
| WhatsApp queue | People join, get their token and updates through WhatsApp | Clinics, restaurants, service centres, some temples | Uses an app people already have | Needs WhatsApp Business setup, depends on internet |
| QR or web virtual queue | Scan a QR code or open a link to join the line, no app download | Hospital OPDs, retail, events | No hardware for the visitor, wait anywhere | Needs a smartphone, no-shows |
| App-based booking or virtual queue | Book a slot or join a line through an app or portal | Pilgrimage sites, theme parks, government services | Spreads arrivals across the day, strong data | People without smartphones get left out, slot hoarding |
| ID-linked tokens (RFID, smart card, biometric) | A card or ID tracks each person’s entry and movement | Vaishno Devi, Hajj, Char Dham | Real-time headcounts, hard caps, safety | Higher cost, privacy questions |
Why messaging apps are becoming the front door
The reason WhatsApp keeps coming up in queue projects is reach.
Meta says WhatsApp passed 3 billion monthly users in 2025, as Mark Zuckerberg confirmed on the company’s first-quarter earnings call. In December 2024 Meta said India alone has more than 500 million WhatsApp users.
When a token can arrive on an app that almost everyone already uses, the visitor doesn’t need to download anything. That’s exactly why TTD now issues Vaikuntha Dwara darshan tokens through its website, app and WhatsApp.
For clinics, this matters a lot. Recall that 80% of patients said knowing their wait time would reduce their frustration. A WhatsApp message with your token number and “about 20 minutes to go” is the cheapest way we know to deliver that.
What consumers say they want
The direction is clear from the survey data. In a 2024 study, 52% of US consumers preferred virtual queues to physical lines, and nearly 70% would rather schedule an appointment than wait in line.
But no single method wins everywhere. A few practical things we’ve learned:
- Keep a walk-in path. Every large site we studied, from Sabarimala to Tirumala, still keeps spot booking or offline tokens for people who can’t book online.
- Plan for no-shows. Around 10% of Sabarimala virtual queue bookings didn’t turn up on one early-season day. Booking systems need a way to release unused slots.
- A human greeting still counts. Remember the J.D. Power finding: greeted customers who waited 6 to 10 minutes were happier than ungreeted customers who didn’t wait at all.
- Measure from day one. The biggest difference between a paper token and a digital system isn’t the token. It’s the data: arrivals per hour, wait per service, time per counter, and walkaways.
Matching the method to the situation
In our experience, the right setup mostly depends on four things.
- Daily volume. Under about 50 visitors a day, a register or manual token can be enough. Once you’re into hundreds, you need routing and wait estimates.
- Number of services. One service, one line works fine. Several services (registration, billing, pharmacy, lab) need a system that sends each person to the right counter.
- Where people wait. If they can wait elsewhere (car, cafe, home), a virtual queue frees up your space. If they must stay on site, focus on clear screens and comfortable seating.
- Who needs the data. A single branch manager may want a daily report. A head office with 30 branches wants a live dashboard and comparisons across sites.
Vehicle queues: the waiting nobody sees
Queues aren’t only made of people. At warehouses, factories, ports and logistics hubs, the queue is a line of trucks with engines running. US data shows drivers were held up at 39.3% of all stops in 2023, and appointment systems at ports have cut truck turn times by 16% to 45%.
What truck waiting costs
The best data comes from the US.
The American Transportation Research Institute (ATRI) defines detention as more than two hours spent at a customer facility waiting for loading or unloading. In its 2024 study:
- Drivers reported detention at 39.3% of all stops in 2023.
- Each driver lost between 117 and 209 hours a year to detention, depending on the sector.
- For-hire trucking alone lost more than 135 million hours in 2023.
- 94.5% of fleets charge detention fees, but fewer than half of those invoices get paid.
- Detained trucks drove 14.6% faster on average than trucks that weren’t detained.
ATRI put the cost at $3.6 billion in direct expenses plus $11.5 billion in lost productivity for 2023.
An earlier audit by the US Department of Transportation’s Office of Inspector General estimated that every extra 15 minutes of average dwell time at a facility raises the expected crash rate by 6.2%. It also linked detention to $1.1 billion to $1.3 billion a year in lost earnings for truckload drivers, or about 3.0% to 3.6% of a driver’s annual income.
The OIG’s crash figure is a fleet-level association, not proof that any single delay causes a crash. Still, it’s a federal estimate that ties waiting directly to road safety.
Appointment systems: the vehicle version of a virtual queue
Ports were early adopters of booked time slots for trucks. The results are some of the clearest numbers in the whole queue management field.
| Site | What changed | Result | Source |
|---|---|---|---|
| Port of New York and New Jersey (GCT terminal) | Truck appointment system for unloading | Turn times down 45% | Supply Chain Dive |
| GCT Bayonne, New Jersey | Staged truck reservation system (2017) | Turn times down more than 40% vs non-appointment trucks | GCT presentation, EPA |
| Port of Virginia, Virginia International Gateway | Truck Reservation System from March 2018 | Turn times down 32% | Bulk Transporter |
| Port of Virginia, Norfolk International Terminals | Same system | Turn times down 16% | Bulk Transporter |
| Port of Vancouver | Two-hour appointment windows | Average turn time of 22 to 28 minutes including queuing, with fewer than 3% over 90 minutes | Supply Chain Dive |
The Port of Virginia’s CEO summed up the thinking in plain words: spreading truck volume across the day is the only way to get efficient gates. By that point the system had handled 292,588 reservations and covered more than 70% of truck gate capacity at both terminals (same source).
Simulation studies point the same way. A model of a bulk cargo terminal found appointment systems could cut truck turnaround times by up to 65% and engine idling emissions by up to 80% compared with no intervention (Aalborg University). A study of an Australian woodchip export terminal put the gain at up to 23% (University of Tasmania).
Why this is spreading beyond ports
The same logic now applies to warehouses, distribution centres, factories and cold stores. Trucks arrive at random, crowd the gate in the morning, and sit idle while docks are free in the afternoon.
A vehicle queue system books a slot, reads the plate at the gate (often with ANPR cameras), assigns a dock, and calls the driver forward when the dock is ready. It’s the same idea as a token on a hospital screen, just with number plates instead of names.
How big is the queue management market?
Most research firms put the global queue management system market at around $0.9 billion in 2024, growing roughly 6% to 8% a year. The estimates vary a lot, so we’d treat any single number with care.
| Research firm | Estimate | Growth rate | Source |
|---|---|---|---|
| Global Industry Analysts | $906.0 million in 2024, reaching $1.3 billion by 2030 | 6.0% CAGR | GII |
| 360iResearch | $872.2 million in 2024, reaching about $1.38 billion by 2030 | 7.9% CAGR | GII |
| Technavio | Growth of $296.5 million between 2024 and 2029 | 6.3% CAGR | Technavio |
| The Insight Partners | $482.7 million in 2022, reaching $739.0 million by 2030 | 5.5% CAGR | App Developer Magazine |
The spread comes from where each firm draws the line. Some count only queue software. Others include kiosks, displays, ticket printers and services. Some include appointment scheduling, others don’t.
A few other details from these reports are useful context. Global Industry Analysts expects China’s market alone to reach $206.2 million by 2030. The Insight Partners found banking and financial services held the largest share in 2022.
One thing these figures likely miss is how much queue management is now bundled into other systems: hospital information systems, visitor management, parking and yard platforms. From where we sit, the line between “queue system” and “operations platform” is getting thinner every year.
What we saw at Entry2Exit in 2026
This is the part of the research that comes from our own records, not public sources. In short, 2026 is our biggest year yet for queue management. We deployed more queue management systems than in any previous year, received more inquiries than ever, and saw a 30% increase in enterprise customers compared with smaller businesses.
These numbers come from our own project and inquiry records for 2026 so far, compared with earlier years. They reflect one company’s view, mostly across the GCC and the markets we serve, so please read them that way.
Record deployments and record inquiries
2026 is the year we deployed the most queue management systems, across the widest mix of organisations we’ve worked with.
It’s also the year we received the most inquiries for queue management. Some of that is our own growth. But a lot of it, in our view, is that organisations now see queue data as something they need to manage, not just a line to tolerate.
Enterprises moved faster than small businesses
The clearest shift in our numbers is who is buying. This year we saw a 30% increase in enterprise customers compared with smaller businesses.
From our conversations with these customers, three things come up again and again.
- Trust signals. Enterprises want proof before they commit: reference sites, years in operation, support coverage and a vendor that will still be around in five years. We think we’ve reached the point where we meet that bar for more of them than before.
- On-premise installation. Many enterprise clients, especially in healthcare and government, prefer the system and its data to sit on their own servers, under their own IT policies. Cloud-only products are often ruled out early.
- Multi-branch rollouts. Enterprises rarely buy for one site. They want one setup across many branches, with central reports that compare wait times and service times between locations.
We’re also seeing more enterprises come to us from other queue systems. Usually it’s because they’ve outgrown a product built for a single branch, or because they need deployment and reporting options their current system doesn’t offer.
Healthcare is leading the growth
Healthcare is the sector where we’ve seen the biggest increase in queue management demand.
That lines up with everything in this article. Hospitals and clinics have the longest waits relative to service time. Patients walk out or switch providers over it. And governments, as India’s Scan and Share programme shows, are now measuring queue time at national scale.
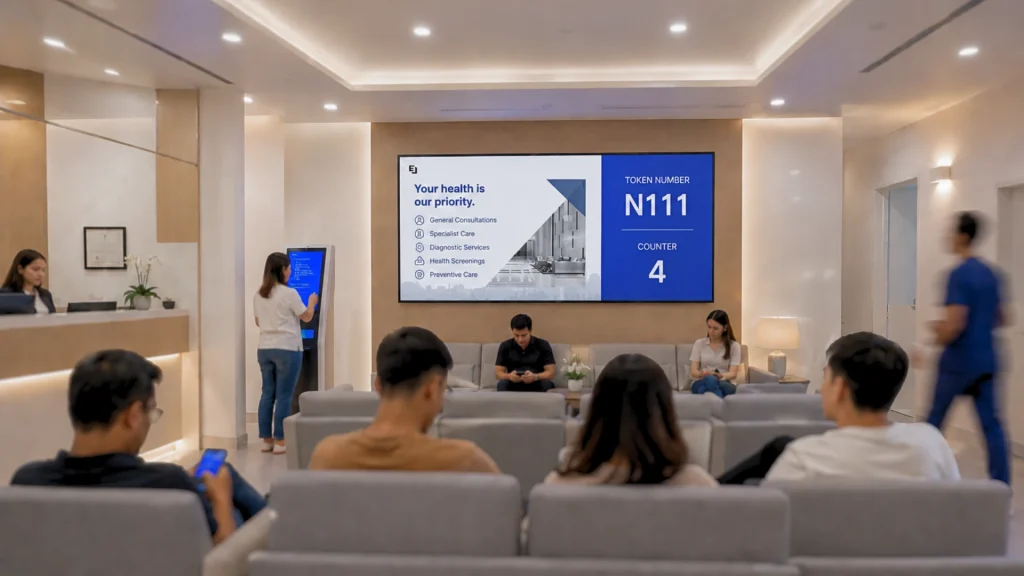
What clinics ask us for has also changed. A few years ago the request was usually a ticket printer and a display. Now it’s more often a full patient flow:
- The patient gets a token through an online form, a QR code scan on arrival, or a self-service kiosk.
- The token arrives by WhatsApp, SMS or email, or is printed at the kiosk.
- The patient waits in the lobby or steps out, and is called by a notification, a screen showing the token and counter, and a voice announcement (in Arabic or English in many of our deployments).
- Staff can call, transfer, mark no-shows and re-assign tokens between counters.
- The patient leaves quick feedback on a tablet on the way out.
- Managers download logs by date to see wait time and service time per counter.
Vehicle queuing is the new frontier
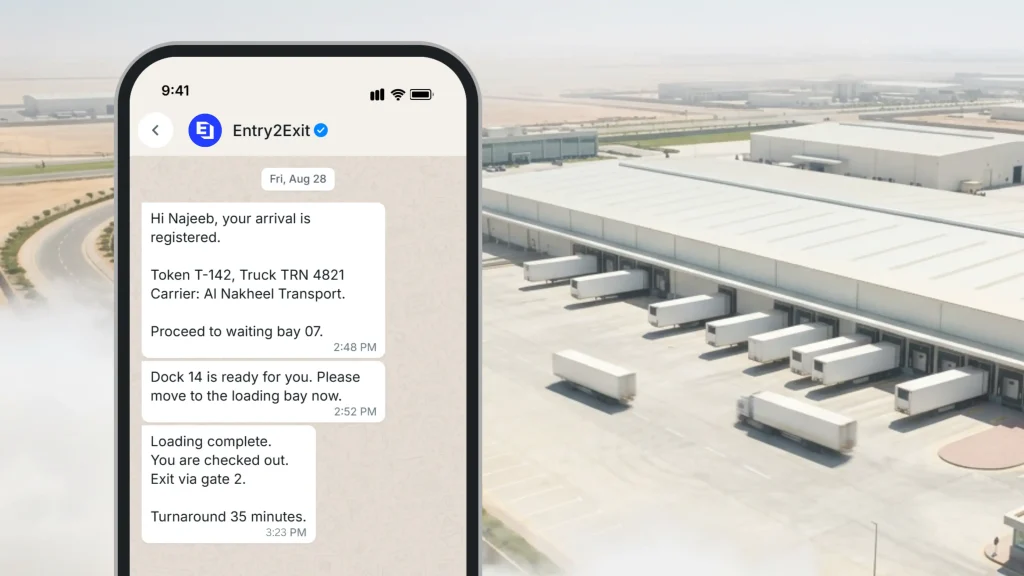
The other big change this year is vehicles. We’ve seen a strong increase in requests from logistics centres, warehouses and industrial sites that need to queue trucks, not people.
The typical need is simple to describe and hard to do on paper: control which truck goes to which dock, and when. That means booking slots, reading plates at the gate, holding trucks in a waiting area, and calling them forward when a dock is free.
Given the detention and turn-time data in the earlier section, we expect vehicle queuing to be one of the fastest growing parts of this field over the next few years.
What our data can’t tell you
We want to be clear about the limits. Our numbers come from one vendor, and our customer base leans toward the GCC and the enterprise segment. They show the direction of demand we’re seeing, not the size of the whole market. For market-wide figures, use the independent estimates in the previous section.
What the numbers add up to
After going through all of this, six things stand out to us.
- How a wait feels matters as much as how long it is. People overestimate waits by 36% in shops and by two to five times in other settings. Telling them the expected wait reduces that gap.
- The breaking point is short. In retail it’s four to five minutes. For most services it’s about 15 minutes. After that, people leave, and many don’t come back.
- Service is quick, waiting is slow. In Indian hospital OPDs, patients wait 8 to 15 minutes for every minute with the doctor. Fixing the wait often matters more than speeding up the service.
- Time slots work. Slotted darshan at Tirumala takes a third of the time of the open queue. Truck appointment systems cut port turn times by 16% to 45%.
- The token counter can become the danger point. Tirupati in 2025 showed that a queue for tokens can be as risky as the crowd it was meant to control. Moving token issue online, with a fair draw, removes that bottleneck.
- Data changes behaviour. The UAE publishes waiting time as a government KPI. Hajj authorities read millions of smart card scans. Once a wait is measured, it gets managed.
For us, the biggest lesson is simple. People are surprisingly patient when they know where they stand, can see it’s fair, and are free to wait somewhere comfortable. Most of what a good queue system does is give them those three things.
Sources, method and how to cite this research
A note on the sources
Every figure from outside Entry2Exit is linked where it appears in the article. Where we could, we linked the original publisher, such as a journal, a government ministry or a statistics authority. Where the original sits behind a paywall or is hard to reach, we linked a reliable report of it and named the original study in the text.
Some sources are older. The M/A/R/C, EE and Box Technologies retail surveys are from 2008 to 2015, and Maister’s paper is from 1985. We kept them because they’re still the most cited work on their topics, and newer surveys broadly agree with them.
Several of the consumer surveys were commissioned by companies that sell queue, payment or retail technology. We’ve said so where it applies.
Main sources by topic
- Psychology of waiting: Maister, 1985 · Hornik, 1984 · Antonides et al., 2002 · Hess et al., 2004 · Fioreze et al., 2019
- Consumer surveys: M/A/R/C Research · Box Technologies · EE · Adyen 2018 and 2019 · Qudini
- Healthcare: MoHFW Scan and Share update · IJCM 2024 (Kolkata) · IJPH 2024 (Faridabad) · PGIMER study · AMN Healthcare and Merritt Hawkins 2022 · Software Advice · National Audit Office, 2026
- Banking, government and airports: J.D. Power Singapore 2017 · Dubai Media Office (RTA) · WAM (Dubai Customs) · TSA
- Crowds and pilgrimages: PLOS One 2024 (Itaewon) · Factly (NCRB data) · Verdictum (Kerala High Court on Sabarimala) · Shri Mata Vaishno Devi Shrine Board yatra statistics · GASTAT Hajj Statistics 2025 · Ministry of Hajj and Umrah
- Vehicles: ATRI 2024 · US DOT OIG 2018, via Truck News · Port of Virginia, via Bulk Transporter · Supply Chain Dive